PET ceramic substrates are widely used in flexible electronics and LED packaging, but mismatched coefficients of thermal expansion (CTE) between the PET polymer layer, ceramic filler, and copper circuitry remain a leading cause of delamination, warpage, and cracking failures. This technical article provides a comprehensive overview of CTE-related failure mechanisms in PET ceramic substrates, along with the sample types, testing items, and analytical methods used in professional failure analysis laboratories. Understanding these failure modes helps engineers select materials, qualify suppliers, and improve product reliability in thermal cycling environments.
Technical Overview
PET ceramic substrates are composite materials that combine a polyethylene terephthalate (PET) polymer matrix with ceramic fillers, typically aluminum oxide or silica powder, to achieve a balance of flexibility, dielectric performance, and thermal dissipation. These substrates are commonly used in flexible printed circuits, LED lighting modules, and compact electronic assemblies. However, the fundamental challenge of this material system lies in the large disparity between the thermal expansion behavior of its constituent layers. PET film exhibits a coefficient of thermal expansion (CTE) of approximately 50 to 70 ppm/°C, while ceramic fillers expand at only 3 to 10 ppm/°C, and copper conductors at approximately 17 ppm/°C.
When a PET ceramic substrate undergoes thermal cycling during soldering reflow, operation, or environmental testing, this CTE mismatch generates significant interfacial stress. The stress concentrates at layer boundaries between the PET base film, the ceramic-filled adhesive layer, and the copper foil. Repeated thermal excursions amplify these stresses and can initiate several characteristic failure modes, including interfacial delamination, substrate warpage and twisting, copper trace cracking, microvoid formation, and brittle fracture of the ceramic-rich layer.
A critical factor in CTE-related failure is the glass transition temperature (Tg) of the PET matrix. Below Tg, the polymer is in a glassy state with a relatively lower CTE (alpha 1), typically 20 to 40 ppm/°C for ceramic-filled systems. Above Tg, the polymer enters a rubbery state where the CTE (alpha 2) can double or triple, dramatically accelerating dimensional change and interfacial stress. Since PET has a relatively low Tg of approximately 78 to 82°C, many LED and power applications routinely operate above this threshold, making CTE failure analysis essential for product qualification and root cause determination.
Testing Samples
Raw PET Base Film Samples
Unlaminated PET film specimens are tested to establish the baseline CTE behavior and verify incoming material quality. Batch-to-batch variation in PET film orientation, crystallinity, and heat treatment history can significantly influence expansion behavior. Both machine direction (MD) and transverse direction (TD) specimens are prepared because biaxially oriented PET film exhibits anisotropic CTE characteristics.
Ceramic-Filled Composite Laminate Samples
These samples represent the core composite structure consisting of PET resin loaded with ceramic particles. Testing these specimens isolates the effective CTE of the composite layer, which depends on filler loading percentage, particle size distribution, and interfacial bonding quality. Specimens are typically cut to standardized dimensions of 3 to 6 mm width and 10 to 20 mm length for thermomechanical analysis.
Copper-Clad PET Ceramic Substrates
Fully laminated samples with copper foil on one or both sides are tested to evaluate the composite CTE behavior and adhesion integrity under thermal stress. These samples reveal how the lower-CTE copper layer constrains the expansion of the polymer composite and whether the adhesive system can accommodate the resulting shear stress. Both single-sided and double-sided configurations are examined.
Failed Field Returns and Post-Thermal-Cycling Specimens
Substrates that have failed in service or after reliability testing are submitted for root cause analysis. These specimens may exhibit visible blistering, delamination, warpage beyond specification, or electrical opens caused by cracked traces. Analysis of failed units provides direct evidence of the failure mechanism and allows correlation between measured CTE properties and actual field performance.
Assembled Module Samples
Complete assemblies with soldered components, such as LED packages or power devices, are analyzed to evaluate the three-way CTE interaction among the PET ceramic substrate, copper circuitry, solder joints, and mounted components. These samples are essential for understanding system-level failure where the substrate CTE amplifies stress at solder joint interfaces.
Testing Items
Comprehensive CTE failure analysis requires measurement of the following key parameters:
- Coefficient of thermal expansion below glass transition (alpha 1) per IPC-TM-650 method 2.4.24 or ASTM E831
- Coefficient of thermal expansion above glass transition (alpha 2) per IPC-TM-650 and ASTM E831
- Glass transition temperature (Tg) by thermomechanical analysis per ASTM E1545
- Dimensional stability after thermal exposure per IPC-TM-650 method 2.2.4
- Z-axis expansion and percent expansion before Tg, a key indicator of plated via hole reliability
- Interfacial delamination evaluation by ultrasonic scanning microscopy (C-SAM) per IPC-TM-650 method 2.6.10
- Peel strength retention of copper foil after thermal stress per IPC-TM-650 method 2.4.8
- Warpage and flatness measurement after reflow simulation per IPC-TM-650 method 2.4.22
- Thermal shock and thermal cycling survivability per IPC-TM-650 method 2.6.7 and JESD22-A104
- Heat deflection temperature and softening point as supplementary thermal mechanical indicators
Testing Methods
Thermomechanical analysis (TMA) is the primary technique for CTE measurement. A specimen is placed on a quartz platform and contacted by a low-mass probe. The sample is heated at a controlled rate, typically 5 to 10°C per minute, across a temperature range spanning from room temperature to beyond the expected Tg, often up to 200°C. The instrument records dimensional change as a function of temperature, and the slope of the expansion curve yields the CTE values for both the glassy and rubbery regions. The inflection point of the curve identifies the Tg. Specimens are tested in both in-plane orientations to characterize anisotropy introduced by film processing.
Thermogravimetric analysis (TGA) and differential scanning calorimetry (DSC) are used in parallel to verify ceramic filler content, confirm resin composition, and cross-check the Tg value measured by TMA. Accurate filler loading data is essential because CTE reduction in these composites follows mixing law relationships, and deviations from the specified filler content directly explain abnormal CTE results.
Scanning electron microscopy (SEM) with energy-dispersive X-ray spectroscopy (EDS) is applied to cross-sectioned specimens, both pristine and failed, to examine the ceramic particle dispersion, interfacial adhesion quality, and crack initiation sites. Microscopy reveals whether cracks propagate through the ceramic-rich layer, along the PET-copper interface, or through cohesive failure within the polymer matrix.
Ultrasonic C-SAM imaging detects subsurface delamination that is invisible to optical inspection. By scanning assemblies before and after thermal cycling, analysts can map the progression of interfacial separation and correlate delamination area growth with the magnitude of CTE mismatch.
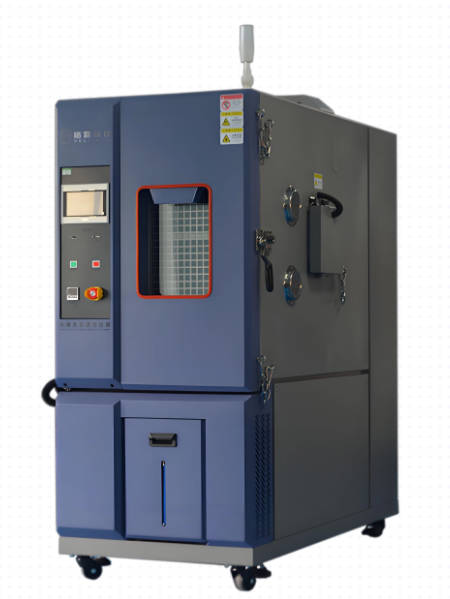
Thermal cycling chambers execute programmed profiles, such as -40°C to +125°C with dwell times per JESD22-A104, to reproduce field stress conditions. Electrical continuity monitoring during cycling identifies the cycle count at which resistance increases or opens develop, quantifying the fatigue life impact of the measured CTE mismatch. Strain gauge measurements and shadow moiré techniques supplement this by mapping real-time strain distribution across the substrate during heating.
Applications
CTE failure analysis of PET ceramic substrates supports quality assurance and product development across multiple industries:
- Flexible LED lighting strips and backlit display modules where sustained operating temperatures approach or exceed the PET glass transition
- Automotive interior lighting and sensor modules subjected to wide temperature swings and vibration
- Consumer electronics including flexible hybrid circuits, antenna modules, and wearable device substrates
- Thermal management interface layers in compact power supplies and battery management systems
- Supplier qualification and incoming material inspection programs for PCB and flexible circuit manufacturers
- Root cause investigation of field failures and customer returns to support corrective action and warranty claims
- New material development programs validating ceramic filler formulations and adhesive systems for reduced CTE
FAQ
What CTE values are acceptable for PET ceramic substrates?
Acceptance limits depend on the application, but most flexible circuit specifications require an in-plane CTE below 40 ppm/°C below Tg to maintain dimensional stability and copper adhesion. For LED applications with high operating temperatures, composites with lower effective CTE, achieved through higher ceramic loading, are preferred, and the expansion above Tg should be minimized to prevent delamination during soldering.
Why does delamination occur during reflow soldering?
Reflow temperatures of 245 to 260°C far exceed the PET glass transition temperature, causing the polymer matrix to expand at several times its glassy-state rate while the copper and ceramic remain dimensionally constrained. The resulting shear stress at the interface exceeds adhesive bond strength, producing instantaneous or progressive delamination, blistering, and warpage.
How is the failure distinguished between CTE mismatch and moisture absorption?
Comparative testing resolves this question. Specimens are baked to remove moisture and then subjected to CTE measurement and simulated reflow. If delamination disappears after baking, moisture is the primary driver. If failures persist in dry specimens and correlate with measured CTE values, thermal expansion mismatch is confirmed as the root cause. Often both mechanisms interact, and a complete analysis evaluates each contribution.
Can a failed substrate be requalified after CTE-related delamination?
No. Interfacial delamination and stress cracking are permanent mechanical damage. Once the adhesive bond line has separated, thermal transfer, electrical insulation, and mechanical integrity are permanently degraded. Corrective action requires material substitution, lamination process improvement, or design changes that reduce thermal excursion severity, followed by full requalification of a new production batch.
How long does a complete CTE failure analysis take?
A standard analysis including TMA characterization, compositional verification, cross-sectional microscopy, and a report with root cause conclusion typically requires five to ten working days. Extended programs incorporating thermal cycling to failure with in-situ electrical monitoring may require three to four weeks depending on the required cycle count and sample quantity.