Sensor temperature drift testing evaluates how a sensor's zero point, sensitivity, and measurement accuracy change when the device is exposed to varying ambient temperatures. This critical reliability test allows manufacturers to quantify temperature coefficients, verify the effectiveness of compensation circuits, and confirm stable performance across the entire operating temperature range. This guide covers the test principles, sample categories, procedures, data analysis methods, and applicable international standards.
Technical Overview
Temperature drift refers to the change in a sensor's output signal that is caused solely by ambient temperature variation rather than by the quantity being measured. Because sensor materials, semiconductor junctions, and signal-conditioning electronics all exhibit temperature-dependent behavior, no real-world sensor is perfectly immune to thermal effects. Temperature drift testing is therefore performed to quantify these effects and to verify that the device remains within specified accuracy limits over its rated temperature range.
The main physical causes of temperature drift include the temperature dependence of piezoresistive coefficients, changes in semiconductor bandgap and carrier mobility, thermal expansion mismatch between sensing elements and packaging materials, residual stress released during thermal cycling, and offset or gain shifts in amplifiers and ADC circuits. Temperature drift testing measures these effects under controlled laboratory conditions using climatic chambers and reference standards.
Zero-Point Drift
Zero-point drift describes the shift of the sensor output at zero input as temperature changes. It is typically expressed as a percentage of full-scale output per degree Celsius (%FS/°C) or in parts per million per degree Celsius (ppm/°C), and is often referred to as the temperature coefficient of offset (TCO).
Sensitivity Drift
Sensitivity drift, also called span or gain drift, describes the change in the slope of the sensor transfer function as temperature varies. It is quantified as the temperature coefficient of sensitivity (TCS) and directly affects measurement accuracy at the upper end of the input range.
Thermal Hysteresis
Thermal hysteresis is the difference in sensor output at the same temperature when that temperature is approached from a rising direction versus a falling direction. It reveals mechanical stress effects and non-reversible structural behavior within the sensing element or its packaging.
Testing Samples
Temperature drift testing applies to virtually every sensor category used in industry, transportation, science, and consumer products. Typical sample groups include:
Pressure Sensors and Transmitters
Piezoresistive, capacitive, and resonant pressure sensors are highly sensitive to temperature because their diaphragm materials and sensing elements change stiffness and resistivity with heat. Pressure transmitters for process industries are routinely tested for zero and span drift across ranges such as -40°C to +85°C.
Inertial and MEMS Sensors
Accelerometers, gyroscopes, and inclinometers based on MEMS technology exhibit bias and scale-factor drift with temperature. These devices are tested extensively for automotive safety systems, drone stabilization, and navigation platforms.
Weighing and Force Sensors
Strain-gauge load cells, torque sensors, and force transducers undergo zero drift and sensitivity drift testing in accordance with metrological regulations before receiving accuracy class approvals for commercial weighing applications.
Environmental and Gas Sensors
Humidity sensors, gas sensors, flow sensors, and displacement sensors also require drift evaluation because their chemical sensing layers and optical components respond to thermal conditions in addition to the target measurand.
Testing Items
A complete temperature drift test program typically evaluates the following items:
- Zero-point output drift versus temperature (TCO)
- Sensitivity or span drift versus temperature (TCS)
- Combined total error band across the compensated temperature range
- Thermal hysteresis between rising and falling temperature sequences
- Warm-up drift and output stabilization time at each temperature point
- Return-to-zero performance after thermal cycling
- Nonlinearity and repeatability variation at extreme temperatures
- Long-term drift during extended dwell at elevated or sub-zero temperatures
The specific items selected depend on the product specification, the accuracy class claimed by the manufacturer, and the requirements of the applicable industry standard.
Testing Methods
Test Equipment and Setup
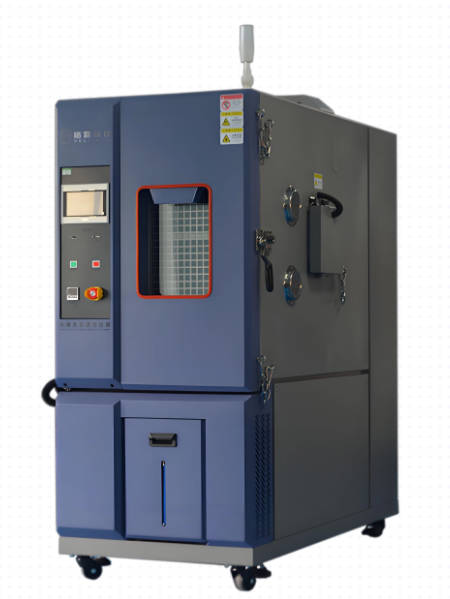
The core equipment includes a programmable temperature and humidity climatic chamber with a typical uniformity of ±0.5°C to ±2°C, a calibrated reference standard such as a precision pressure generator, reference load cell, or deadweight tester, a high-resolution data acquisition system, and signal conditioning hardware. For pressure and flow sensors, feedthrough ports allow the measurand to be applied inside the chamber while the reference standard remains at stable ambient conditions.
Temperature Cycling Procedure
The standard test sequence proceeds as follows:
- Perform a baseline calibration of the sensor at the reference temperature, usually 23°C or 25°C, recording zero output and full-scale output.
- Place the sample in the chamber and step through defined temperature points, commonly at intervals of 20°C or 25°C across the operating range, for example -40°C, -20°C, 0°C, +25°C, +50°C, +70°C, and +85°C.
- At each temperature point, allow a stabilization soak period, typically 30 minutes to 2 hours, or until the sensor output rate of change falls below a defined threshold.
- Apply reference inputs at each point, usually zero and full scale for production tests, or a five-point calibration profile for type evaluation and metrological approval.
- Record outputs after stabilization, then continue to the next temperature point using a controlled ramp rate, typically 1°C/min to 3°C/min.
- Repeat the sequence in the descending direction to evaluate thermal hysteresis, and return to the reference temperature to verify return-to-zero behavior.
Data Analysis and Calculation
Zero drift is calculated as the difference between the zero output at each temperature and the baseline zero output, normalized by the full-scale output and the temperature interval. Sensitivity drift is calculated as the percentage change in span relative to the span at reference temperature. Results are expressed in %FS/°C, %FS/10K, or ppm/°C, and compared against the manufacturer's specification limits. Maximum deviation values across all temperature points define the total temperature effect used in accuracy class determination.
Relevant Standards
Temperature drift testing is commonly performed with reference to the following standards, selected according to product type and market requirements:
- IEC 60068-2-1, IEC 60068-2-2, and IEC 60068-2-14 for cold, dry heat, and change of temperature tests
- MIL-STD-810 environmental test methods for defense and aerospace applications
- OIML R60 for metrological requirements of load cells
- IEC 60751 for platinum resistance temperature detectors
- IEC 61298 series for process measurement transmitters
- ISO 16063 series for vibration and shock transducer calibration, including temperature sensitivity testing
Applications
Temperature drift test results directly influence product design, quality control, and market acceptance across many industries:
- Automotive: engine management pressure sensors, EV battery monitoring, and safety-critical inertial sensors must maintain accuracy from -40°C to +125°C.
- Aerospace: altimeters, air data sensors, and flight-control inertial units require drift characterization across extreme thermal environments.
- Industrial automation: process transmitters in oil, gas, and chemical plants operate outdoors and in hot equipment enclosures where thermal stability is essential.
- Medical devices: patient monitoring and infusion equipment demand low-drift sensors to guarantee diagnostic accuracy.
- Consumer electronics: smartphones, wearables, and smart home devices rely on drift data to design software compensation algorithms.
- Metrology and trade weighing: regulatory approval of measuring instruments depends on documented compliance with temperature effect limits.
In addition to compliance testing, drift data feeds back into product development, guiding improvements in sensing element materials, packaging design, and digital compensation firmware.
FAQ
What causes temperature drift in sensors?
Temperature drift arises from the temperature-dependent properties of sensing materials, including resistivity changes, thermal expansion mismatch, residual mechanical stress, and offset or gain variation in amplification electronics. These effects cause both the zero point and the sensitivity of the sensor to shift with temperature.
How are drift test results expressed?
Results are usually expressed as a temperature coefficient in %FS/°C, %FS/10K, or ppm/°C, calculated separately for the zero point (TCO) and the sensitivity (TCS). The combined effect may also be reported as a total error band over the compensated temperature range.
What temperature range should be tested?
The tested range must cover the full compensated or operating temperature range stated in the product specification. Common industrial ranges are -20°C to +80°C, while automotive and aerospace devices often require testing from -40°C to +125°C or beyond.
How can temperature drift be reduced?
Design countermeasures include on-chip or on-board temperature measurement with digital compensation algorithms, symmetric Wheatstone bridge configurations, low-drift amplifier selection, stress-isolating packaging, and artificial aging of components before calibration.
How long does a temperature drift test take?
Depending on the number of temperature points, soak times, and whether a rising and falling cycle is required, a typical test lasts from several hours to three days. Extended dwell and long-term stability studies can run for weeks or months.